The framework directive for the sustainable use of pesticides obligates EU member states to reduce health and environmental risks caused by the use of plant protection products. To monitor the trends in risks, the European Commission has designed two harmonised risk indicators as monitoring tools. The indicators are based on:
sales volumes (HRI 1)
number of derogations (HRI 2).
Unlike typical risk calculations, these indicators do not acknowledge the qualities of different pesticides, such as how harmful they are to health and the environment. The sales volumes are multiplied by a weighing factor, which is not based on the substance properties, but on the lists of the regulation on approved active substances (EU) 540/2011).
Category
(EU) 540/2011
Active substances
Weighing factor
1: Low-risk substances
Annexes, part D
Substances that were found less harmful than others in the risk assessment. Includes dozens of substances that are mostly microbiological.
1
2: Other substances
Annexes, parts A and B
Approved substances that do not belong to categories 1 or 3. Includes hundreds of substances such as glyphosate, deltamethrin and acetic acid.
8
3: Candidates for substitution
Annexes, part E
Substances that are persistent, bioaccumulative, carcinogenic, mutagenic or reprotoxic. Includes dozens of substances.
16
4: Forbidden substances
(Not listed)
Substances that are not approved at the EU level.
64
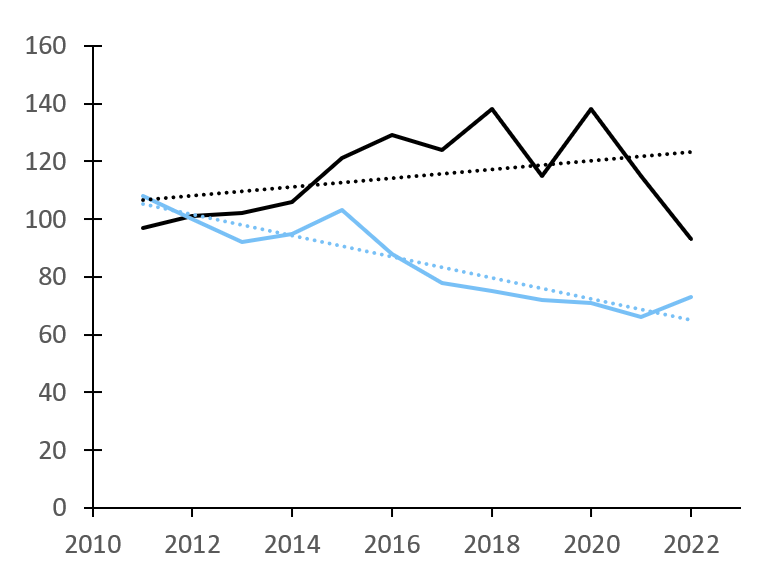
Harmonised Risk-Indicator 1 (HRI 1)
Figure 1. HRI 1 depicts the change in weighted active substance sales volumes in relation to the average for 2011–2013 (indicator value = 100). The official indicator (black) follows closely the sales volume of urea. Without urea (blue), the indicator would be in slight decline.
Based on the indicator, the risk related to the use of plant protection products in Finland is caused nearly solely by urea (~ 70% of the indicator’s value, see Figure 2), and the changes in the sales of urea determine the direction of the indicator. Urea was approved as a low-risk substance in 2024, but the change of weighing factor (from 8 to 1) has not taken place yet. Tukes does not consider the use of urea a significant risk to health or the environment. Urea is used against root rot in forests, so its sales are linked to felling volumes. The Finnish Forest Damages Prevention Act obligates forest owners to carry out pest management in loggings of predominantly coniferous forests during the summer.
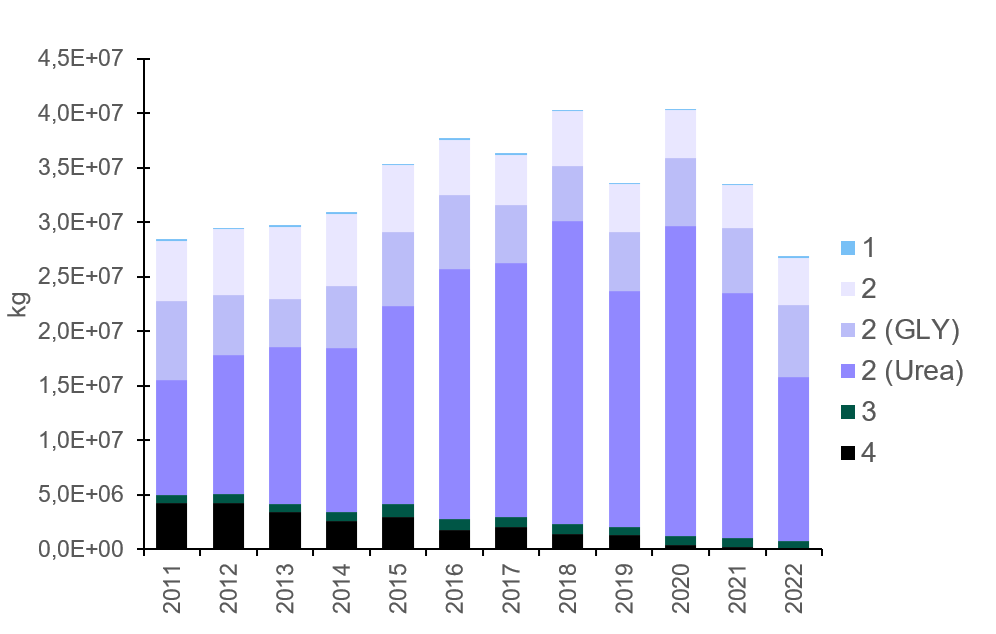
Figure 2. The weighted sales volumes mostly consist of category 2 substances, of which urea and glyphosate are the most sold ones. The weighted sales volumes of categories 1, 3 and 4 are minuscule compared with category 2.
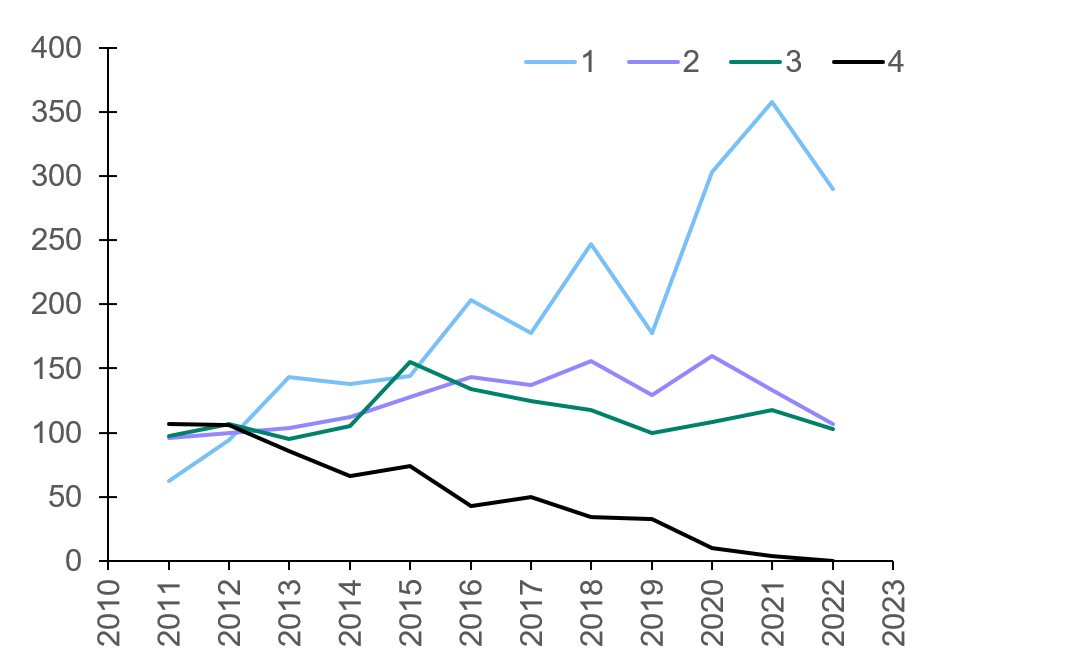
Category-specific indicator values are presented in Figure 3. As the indicator depicts relative change within each category, the baseline of each category has major impact on the indicator value. Adding a couple of tonnes to a low start level (category 1) shows as dramatic change, whilst at the higher start level (category 2), hundreds of tonnes of fluctuation are barely visible. The categories change with the assessment status of the active substances. For example, if a candidate for substitution is banned, its total sales volumes will be transferred from category 3 to category 4.
Figure 3. The category-specific indicator presents change in the sales volumes of the category in question compared with sales in the same category during 2011–2013 (HRI = 100).
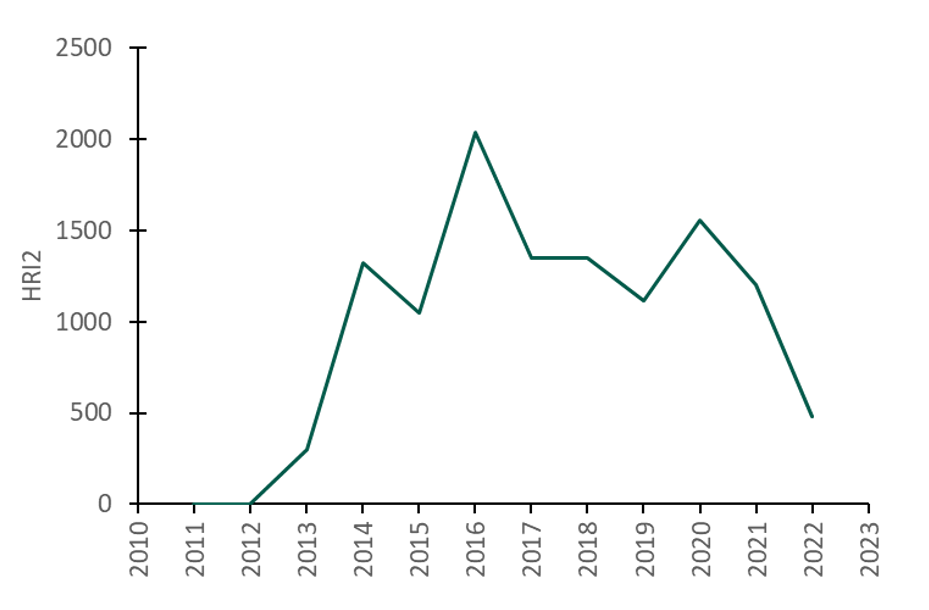
Harmonised indicator 2 (HRI 2)
Figure 4. HRI 2 depicts the weighted number of authorisations by derogation in relation to the average for 2011–2013 (indicator value = 100). The baseline is rather low, as no emergency authorisation were granted during 2011 – 2012.
Tukes may grant authorisation by derogation in emergency situations in plant protection for 120 days for restricted and supervised use.
Reducing risks caused by the use of plant protection products
Through communication, guidance, training, risk assessment and risk management methods, we strive to instruct on the use of plant protection products and reduce the risks of use. Communication is versatile and carried out across multiple channels. Increasing awareness on the risks of plant protection products among both professional and occasional users is an important part of the National Action Plan for the Sustainable Use of Plant Protection Products. Crop production methods to prevent plant pest infestation, following the principles of integrated plant protection, are key in reducing the use and risks of plant protection agents.
Plant protection products containing active substances of particular concern
The European Commission obliges Member States to monitor the use and sale of plant protection products containing active substances of particular concern, as well as the development of the related harmonised risk indicators. In Finland, products containing the following active substances of particular concern were selected for monitoring: glyphosate, azoxystrobin, deltamethrin, esfenvalerate and indoxacarb. The substances were selected in cooperation with experts from, for example, the Finnish Beekeepers’ Association, the Finnish Environment Institute and Tukes.
Glyphosate was chosen as one of the active substances of particular concern to be monitored because it is the most sold plant protection product in Finland and worldwide and its carcinogenic nature is debated.
Azoxystrobin is a widely used fungicide that is often found in surface water monitoring by the Finnish Environment Institute, although in low concentrations.
There is a global concern over the decline in insect populations, which is why the pesticides deltamethrin, esfenvalerate and indoxacarb were selected as substances of particular concern to be monitored. These substances are very toxic to aquatic organisms, as well as to non-target insects.
Indicators of the From farm to fork strategy
With the targets of the Farm to fork (F2F) and Biodiversity strategies, the EU seeks to
halve the use and risks of chemical pesticides by 2030 (F2F 1) and
halve the use of more hazardous pesticides by 2030 (F2F 2).
The progress of these targets is monitored with an indicator that is similar to the HRI indicator, but it has a different reference period (HRI: 2011–2013, F2F: 2015–2017) and examined substances (HRI: Plant protection products, F2F: Chemical plant protection products). As its name suggests, the from Farm to fork strategy concerns agriculture, but the indicator also involves plant protection products used in other sectors.
Because the terms used in the targets are not perfectly unambiguous, we have defined them in the list below.
Pesticide refers to a plant protection product, excluding other control substances such as biocides.
The definition of a chemical substance is still unclear, but it can be used to mean other than microbiological substances, semiochemicals, and substances of biological origin or their equivalent.
More hazardous substances refer to substances defined as candidates for substitution (HRI category 3).
Halving the use refers to reducing sales by half in relation to the average for 2015–2017.
Halving the risks refers to halving the weighted sales volume in relation to the average for 2015–2017.
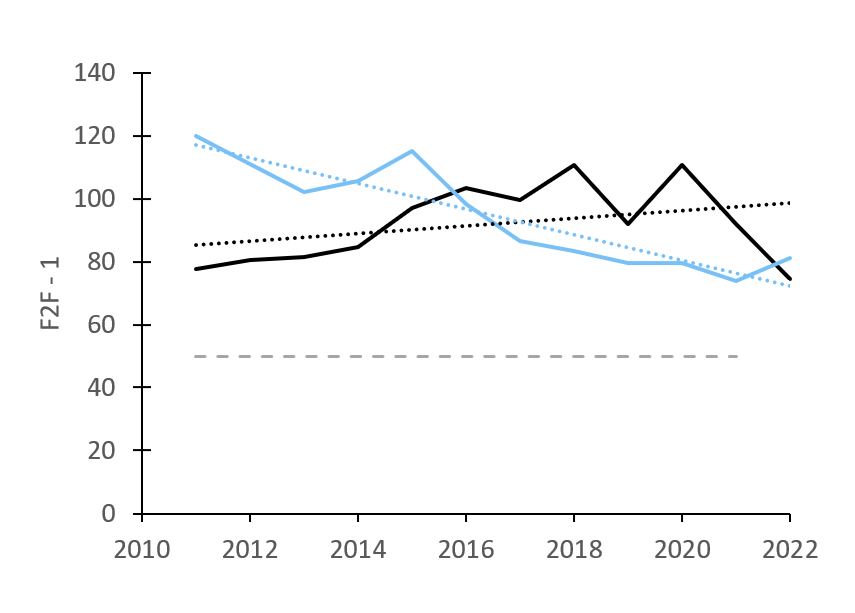
From farm to fork indicator 1 (F2F 1)
Figure 5. The From farm to fork indicator 1 depicts the change in weighted sales volumes in relation to the average for 2015–2017 (indicator value = 100). The official indicator (black) follows the sales volume of urea. Without urea (blue), the indicator would be in slight decline. Based on the targets set in the EU, the official indicator’s value should be less than 50 (grey dotted line) by 2030.
From farm to fork indicator 2 (F2F 2)
Although the F2F 2 indicator does not acknowledge the relative harm of the different candidates for substitution, all candidates for substitution are problematic in one way or another (see Table 1) due to which there have long been attempts to reduce their use. Unlike in the HRI indicator, the historical sales of candidates for substitution are not transferred to another category when the active substance is prohibited.
Figure 6. The From farm to fork indicator 2 depicts the change in sales volumes of candidates for substitution in relation to the average for 2015–2017 (indicator value = 100). Based on the targets set in the EU, the indicator’s value should be less than 50 (grey dotted line) by 2030.